Energy | There's much less than you think
Energy Transition Planning and the Oil Supply
- Date
-
 Richard Lyon
As concern about climate change increases, so too do demands for the boycott of fossil fuel businesses, and to step up investments in renewable technology firms.
But there’s an ugly paradox at the centre of the current energy transition plan. The ultimate goal of renewable energy technology is to replace hydrocarbon as a fuel source for industrial civilisation. Yet the construction, operation, and maintenance of that technology depends on vast volumes of hydrocarbon.
So while climate protesters and energy transition planners may be uninterested in the durability of the hydrocarbon supply in the long term, they have to be very interested in its durability in the short term.
So, an obvious question: how durable is the hydrocarbon supply? More precisely: is the hydrocarbon supply durable enough to ensure the build out of the renewable energy system necessary to replace it?
According to the resource theories of neoclassical economics (the intellectual framework of the current form of capitalism), the answer is “yes”. The assumption that the stock of remaining resource is fixed is wrong and superfluous. As discovered stock is exhausted, ongoing demand generates a rising price signal. Continuously improving technology responds to that price signal, enabling the discovery and development of the next tranche of stock, lowering the price. Rinse and repeat. The correctness of the theory is evident from doomsters' failed predictions of the peak in supply that failure to maintain growth would have generated.
As a theory, it has the considerable merits of being elegant, intuitive, flattering, and commercially and politically convenient. Regrettably, it also has no obvious correspondence with the historical pattern of resource dicovery.
To understand why this is so, we have to step back for a moment to understand a little bit about hydrocarbon reserves book keeping.
To answer our question “how durable is the hydrocarbon supply?”, we have to estimate how long we can keep sticking holes in the ground and finding more oil (the so-called “ultimate volume”).
The projection of a line drawn through a time series plot of cumulative historical discovery volumes yields that estimate.
Every time we stick a hole in the ground looking for more oil, one of three outcomes are possible. We can discover nothing of commercial value. We can discover a new pool of oil. Or we can discover that a previously discovered pool of oil is larger than we thought.
Here’s where it gets sticky. When the hole discovers a new pool of oil, it is perfectly reasonable to mark that volume on the time series graph at the date of discovery. But when the hole discovers that a previously discovered pool is larger than first thought, the time series graph must be adjusted for the new volume at the date of the original discovery. The book keepers call this “backdating”
The physical interpretation of the projection of backdated discovery volumes is the estimate of the total volume of resource that will ever be discovered. Subtracting stock that has already been produced reveals how much stock remains to be discovered.
The physical interpretation of the projection of uncorrected discovery is something entirely different—it’s a measure of the hypothetical volume of stock that would be mobilised at a given time from an infinite stock at a prevailing rate of capital conversion. It reveals nothing about how much stock is available to be discovered.
Failing to backdate volume adjustments therefore results in a significant overestimate of ultimate resource. If that’s not obvious, here’s a thought experiment to help. Stand in a large hall and point a laser at the far wall. The spot on the wall is a projection of total resource. Tilt your wrist a few degrees and watch the spot move several meters up the far wall. That’s the projection of uncorrected discovery data. Now hold the pointer level and raise your arm above your head. Watch the spot move half a meter up the wall. That’s the projection of backdated discovery data.
Graphs of backdated global oil discoveries are uncommon, and you may not have actually seen one. So, for convenience, here it is for oil:
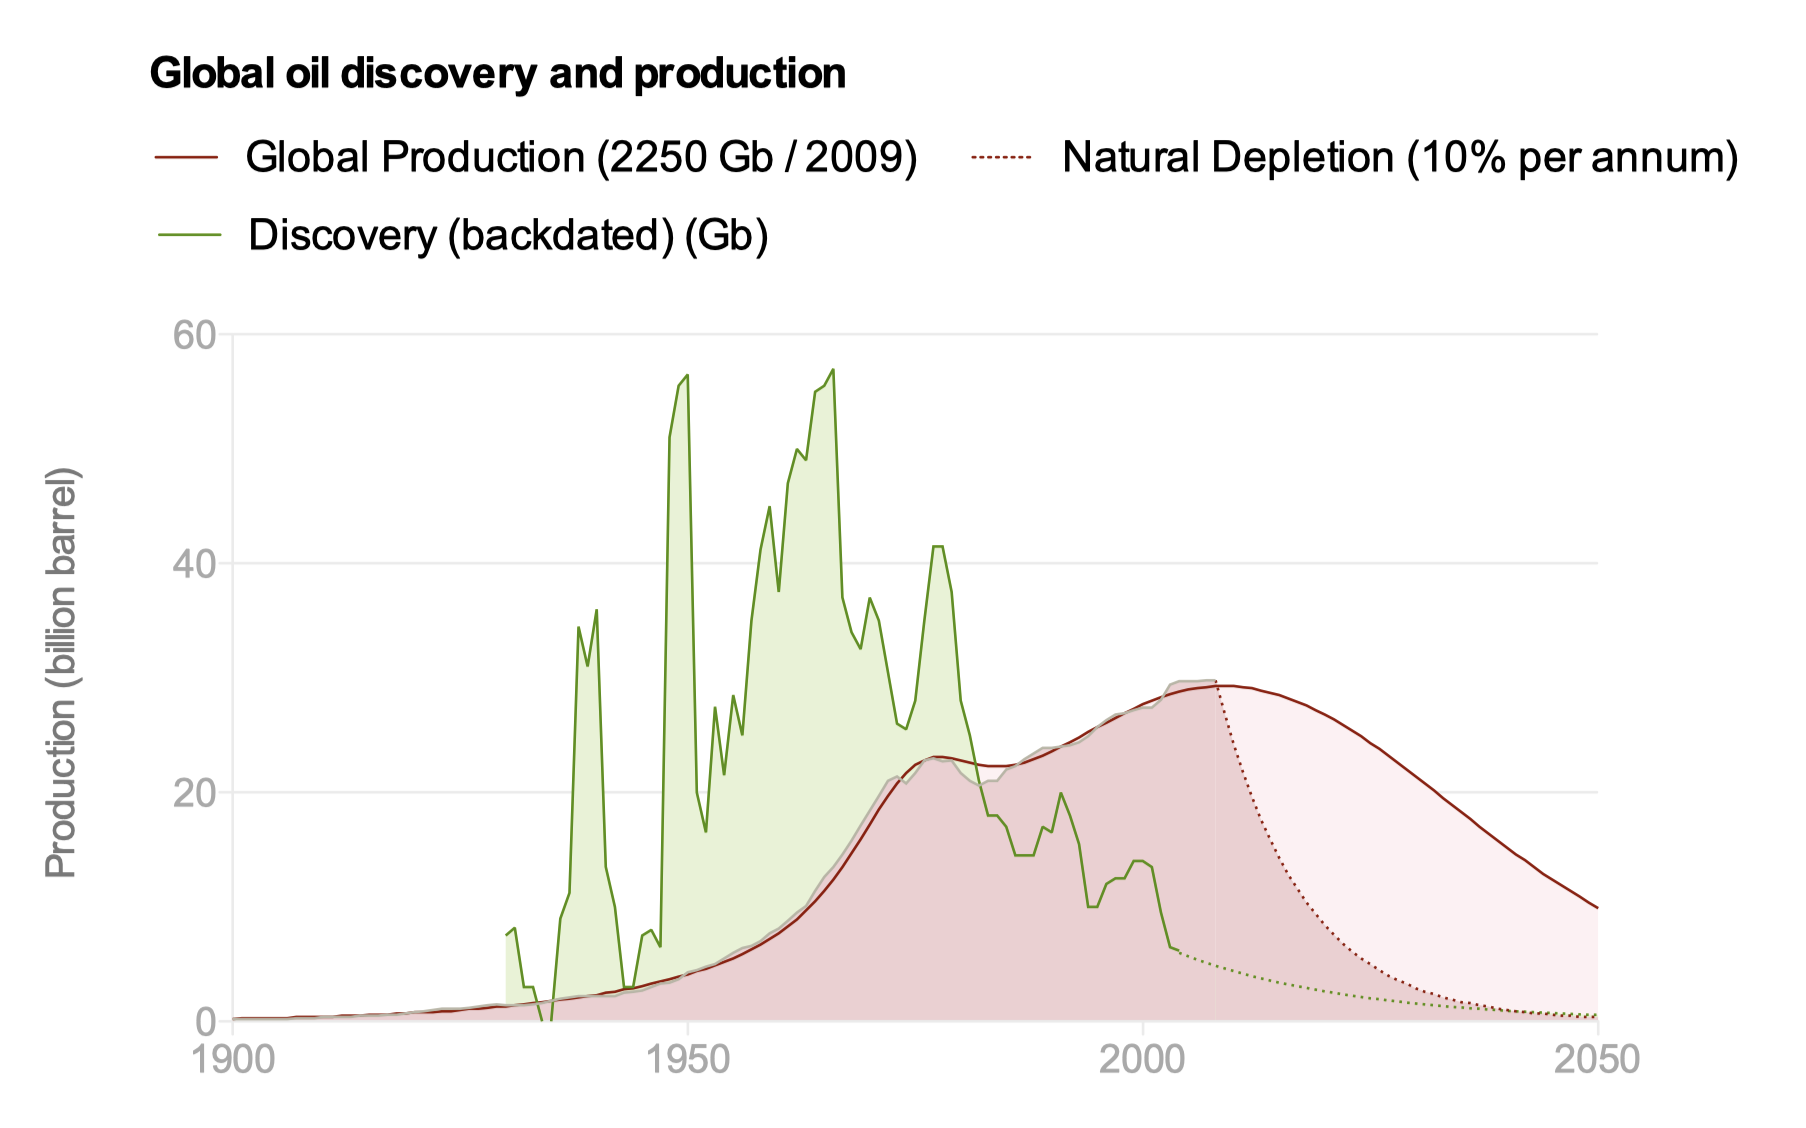
Global oil discovery and production
The majority of all the oil still in production today was discovered either side of the Second World War—most of the oil we use today is from reservoirs that are over 70 years old.
Discovery peaked around 1966. It’s declined at about 15% per year ever since. There are a few small bumps on the way down. The first was the combined discoveries of Alaska North Slope and UK North Sea. The second was the recapitalisation of the Former Soviet Union Oil fields. The third is the temporary contribution from deep water technologies and low EROEI sources. More about that in a minute.
Something quite interesting happened in the ten years after discovery peaked: we landed people on the moon. That program gave rise to the single greatest technological discontinuity in our history: advances in materials science, transistorised electronics, miniaturisation, computerisation, downhole sensing, supercomputer seismic processing, orbital gravimetric sensing, artificial intelligence, etc. It made no material difference to the baseline discovery decline rate, which kept halving every five years.
Technology driven continuous improvement, you’ll recall, is the basis of neoclassical economics assumption that the hydrocarbon supply is essentially “infinite acting”. Unfortunately, it’s simply not observable in the backdated discovery record at any scale that matters.
Moving on. Some basic maths: the plot of the cumulative total of discovery volume is an “S” curve with a point of inflection at the date it peaked (1966), and an asymptote.
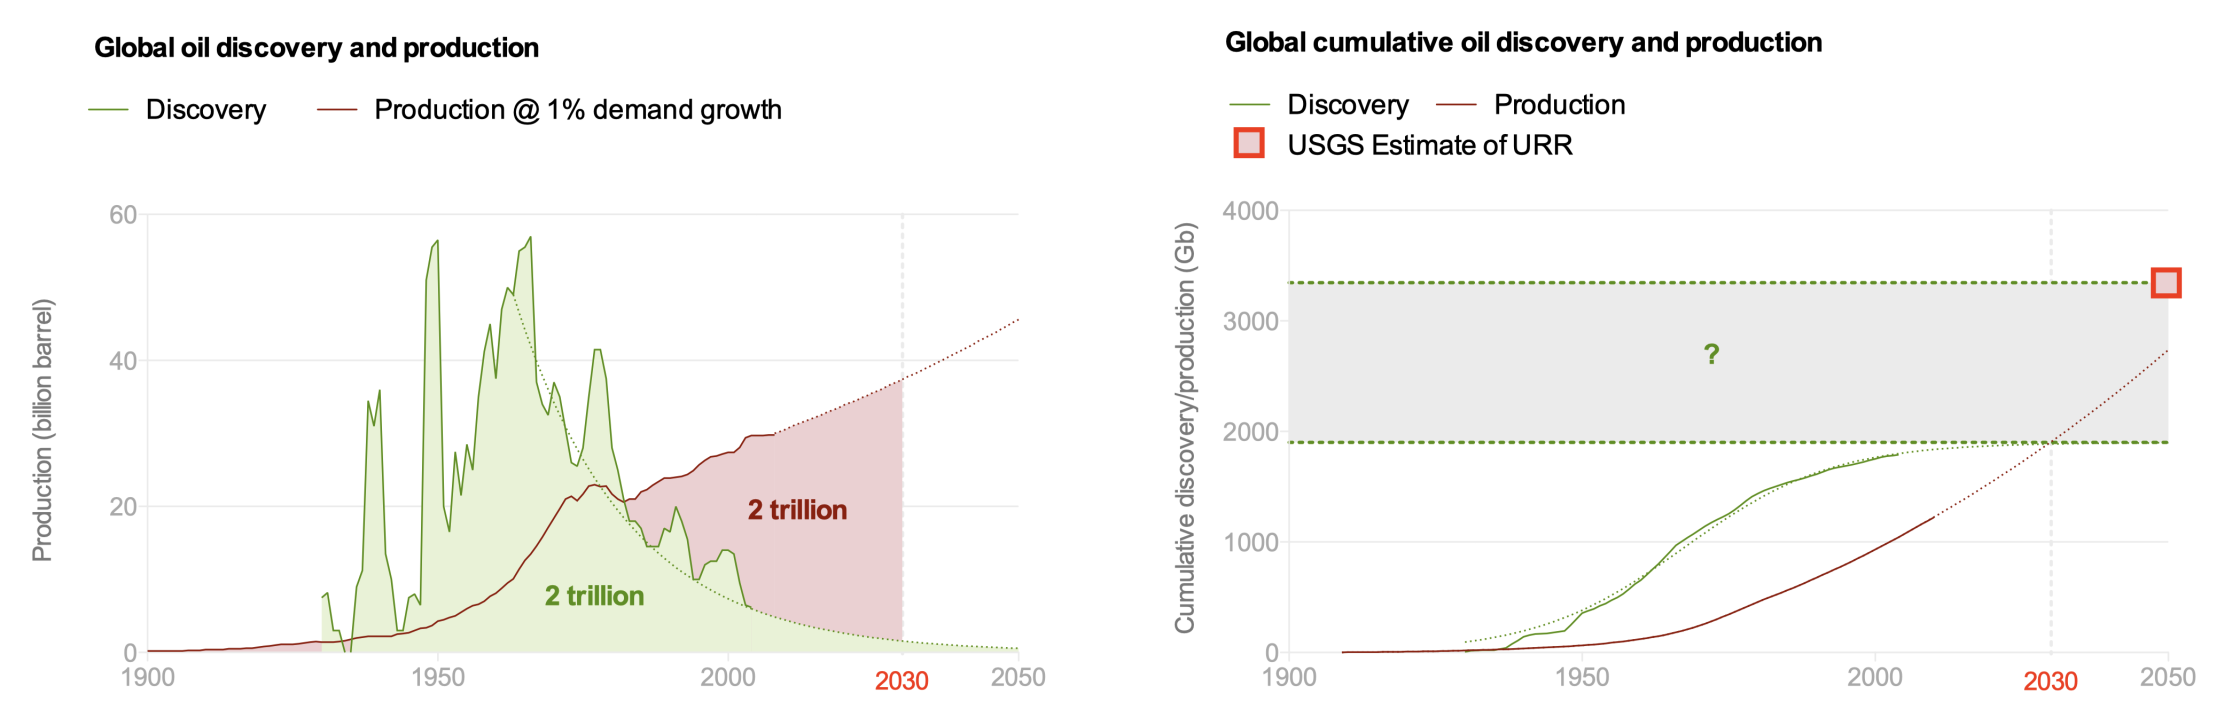
Cumulative oil discovery and production
The physical interpretation of the asymptote is the total volume that was in the ground at the start of exploration. At any date prior to the inflection point, the uncertainty of the asymptote is extremely high i.e. it could be anything. At successive dates after the inflection point, the uncertainty of the asymptote diminishes, and becomes increasingly insensitive even to large volumes of new discovery.
There were 2 trillion barrels of oil in the ground when we started extraction. It’s highly unlikely that anything is going to materially alter that now. (Official estimates typically assume nearer 3 trillion barrels).
Forecasting production from an infinite or infinite-acting supply is complex. Under the “infinite acting” assumption, neoclassical economics (which is to say, most authoritative sources such as the EIA) substitute future demand as a projection of future supply.
Forecasting production from a finite volume, in comparison, is trivial—it’s essentially the pattern of discovery, delayed by a few years, and modified by the choice between producing the remaining volume slowly for a long time, or quickly for a short time. It yields a very different production forecast, as illustrated here by a family of curves having equal areas under their curves corresponding to the remaining resource volume (you may want to reflect for a moment on the implications of the scale of the time axis):
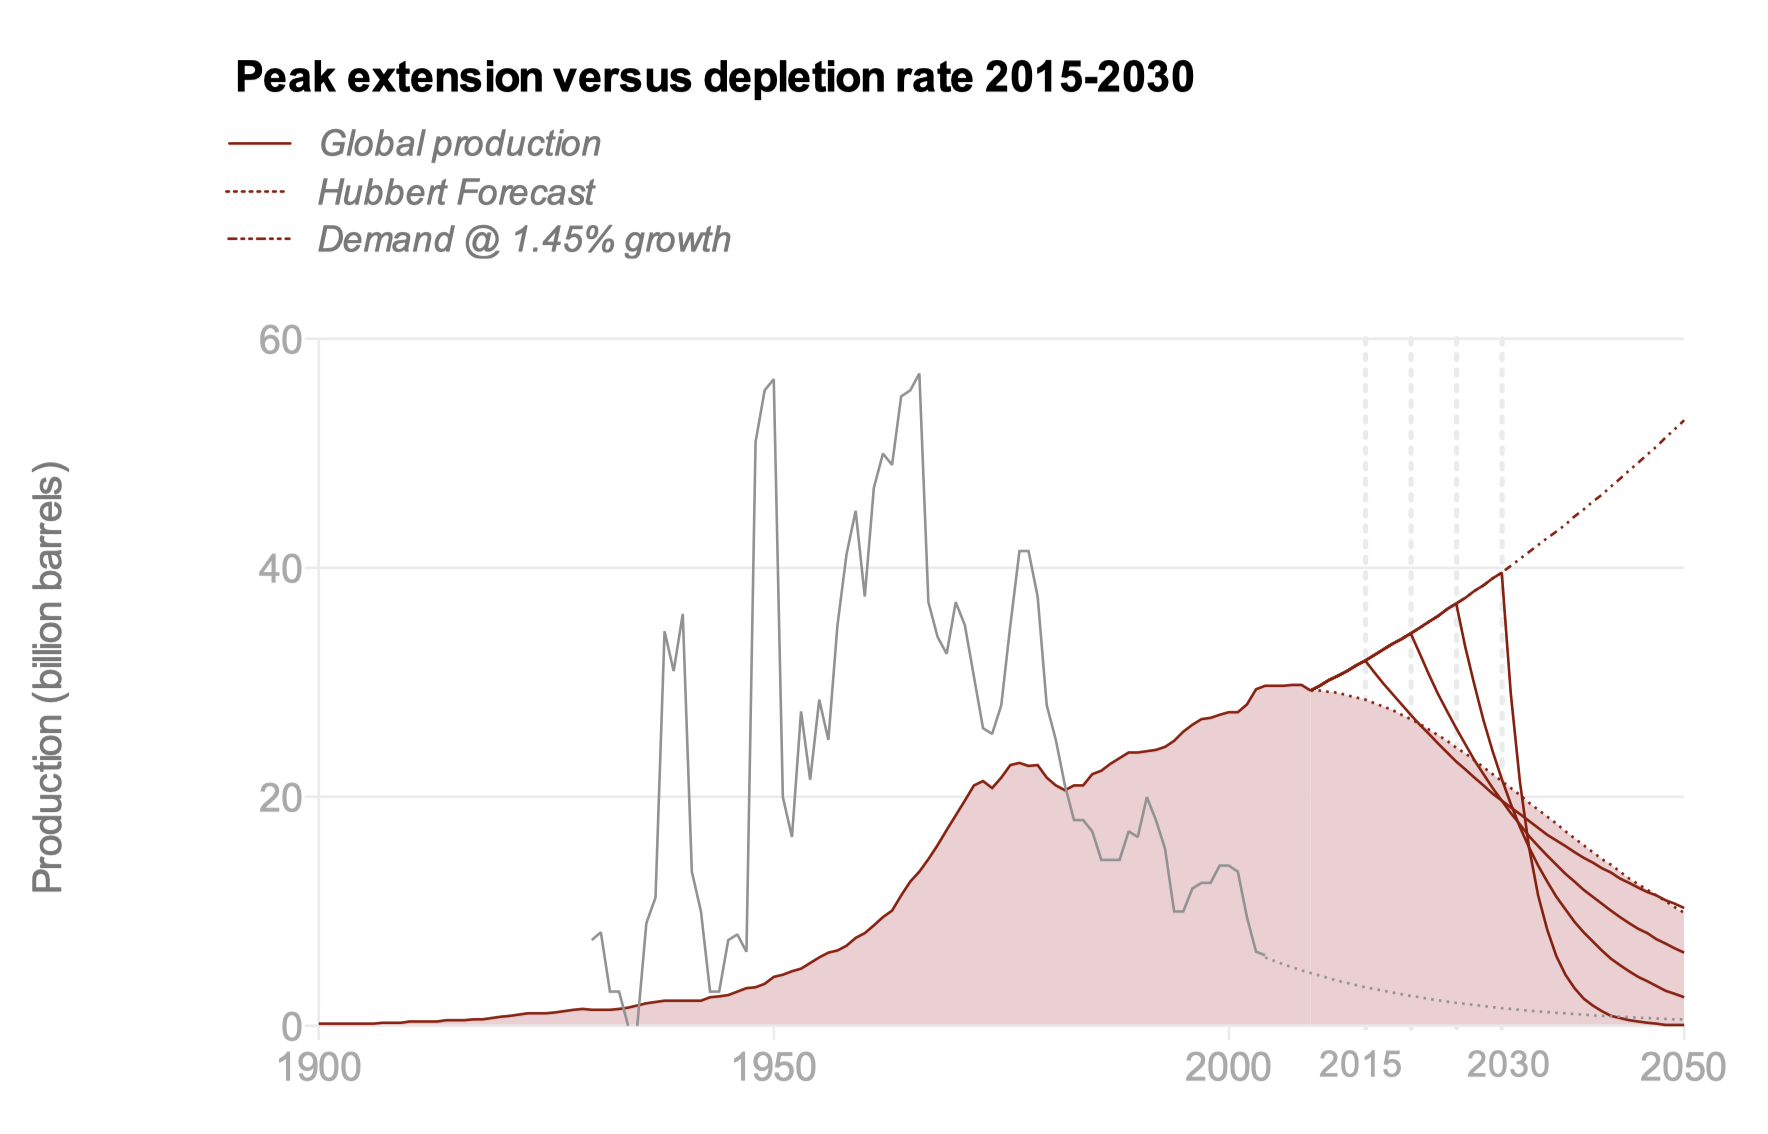
Peak extension versus depletion rate
Doomsters' forecasts of the date of peak oil failed to anticipate the readiness of our financial system after the 2008 energy price triggered system crash to accommodate increasingly uneconomic energy developments. Since 2008, there has been significant creation of new debt and transfer of private equity funds from the stalled economy into some oil developments that have no obvious mechanisms for debt recovery, facilitated by the relaxation of accountancy standards, financial regulations, and reserves classification.
This has accelerated oil forward, maintaining production growth, and deferring peak. But, since the area under the curve is fixed, it has also significantly increased the decline rate of global production that will be experienced after the rising uninvested decline rate overtakes the rate at which investment replaces decline. Whatever the actual date is, it is relatively insensitive now to new discovery volumes: the improbable discovery of a volume the size of the largest current reserves holder delays it by about ten years.
The EROEI of renewable energy sources are up to two orders of magnitude lower than fossil fuels. Replacing fossil fuels by them inherently entails a significant contraction of the net energy supply available to industrial economies. Any contraction unavoidably induces economic stress and requires adaptation. Above a certain rate of contraction, adaptation is not possible, and economies will exhibit unprecedented and widespread malfunction.
Global debt deepened significantly after the 2008 energy shock, and is passing through $256 trillion, leaving the financial system even more vulnerable to economic shock and debt deleveraging. The extent to which gas and coal can be coerced into substituting for oil at the decline rate now hard baked into oil’s profile, under the conditions of economic shock triggered by an aggressive contraction of the oil supply and simultaneous attempt to substitute it by lower EROEI sources, remains to be seen. But there’s little basis to assume that the renewable technology sector will be immune to that economic shock.
There are two troubling implications of this situation for a transition plan based on large scale roll out of renewable energy technologies:
-
It implicitly assumes that the oil supply is “infinite acting”, and therefore sufficient to service its build out energy requirements while simultaneously servicing all of the growing critical energy demands of global industrial civilisation competing for it. This assumption appears to be unfounded.
-
At some point, possibly in the early build out phase, aggressive contraction of the oil supply will commence, likely triggering economic shock and deleveraging. It’s difficult to see how large scale, marginal economic projects that characterise renewable energy technologies can be sustained under those conditions.
Under there circumstances, it could be that the longer that transition planning pursues the goal of large-scale renewable technology led growth that is dependent on primary energy resources that will shortly enter their contraction phase, the less control we will have over energy contraction, and the more severe the shock will be.
If that is the case, then the more certain course of action might be to undertake a fundamental transfer of priorities in energy transition planning away from colossally energy intensive attempts to build generation capability based on renewable energy sources towards capital options for radical demand destruction.
In any event, attempts now to the cut the supply of oil, however well intentioned, appear to be highly ill-advised.